04::Climate
Introduction
The Climate cluster provides a series of components that calculate climate-related infomation and draw corresponding diagrams.
Component Usage
Please refer to the following sections for each component from this cluster.
Climate Evapotranspiration
This component provides an estimation of water information in the soil, such as the monthly evapotranspiration rate, based on the climate data of a particular location and soil information.
Potential Evapotranspiration
Potential evapotranspiration (PET) is defined as the amount of water that would transpire and evaporate if water is adequate [1]. It's an important concept in fields like hydrology, agriculture, and climatology, used for various applications. These include estimating an area's water demand, determining irrigation needs for crops, and assessing drought conditions. It's important to note that PET is usually higher than or equal to actual evapotranspiration because it assumes a condition of abundant water.
PET is influenced by various factors including temperature, humidity, solar radiation, and more [2]. Several methods are available for estimating PET, and their accuracy varies depending on the amount and type of input data required. For example, the FAO-Penman-Monteith method [2], considered the most precise, requires extensive data such as daily measurements of temperature, humidity, radiation, wind speed, and latitude. In contrast, the Thornthwaite method, while less accurate, only needs monthly mean temperature and latitude, making it simpler and less data-intensive. Due to its simplicity and minimal data requirements, the component utilizes the Thornthwaite method [1].
Component Mechanism
The interplay between precipitation and PET governs the water content and demand within the soil. When precipitation exceeds PET, excess water is absorbed and stored by the soil; if the soil becomes saturated, any additional water will run off and the actual evapotranspiration is equal to PET. Conversely, when precipitation is lower than PET, the soil releases its stored water for use. If this reserve is exhausted, the soil experiences water deficiency. In the deficit case, the actual evapotranspiration is equal to the sum of precipitation and current water reserve in the soil. This dynamic is visualized in the diagram on the left, as shown below from reference [1], and it represents the primary mechanism driving this component. Meanwhile, the diagram on the right schematically explains how various inputs influence the output parameters.
![]()
![]()
| Parameter | Abbreviation | I/O | Optional | Explanation |
|---|---|---|---|---|
Precipitation |
P |
No | Monthly precipitation at the given location. | |
Temperature |
T |
No | Monthly average temperature (°C) at the given location. | |
Latitude |
Lat |
No | Latitude of the given location. | |
SoilInfo |
soilinfo |
No | Info about the current soil based on given content ratio, using output from the Soil Analysis component. | |
SoilDepth |
soilDep |
Yes | The depth (m) of the target soil. | |
Potential Evapotranspiration (Corrected) |
PET.corr |
Corrected evapotranspiration (mm/month). | ||
Actual Evapotranspiration |
ETa |
Real evapotranspiration (mm/month). | ||
Surplus |
SUR |
The water that is not evapotranspired or held in the soil (mm). | ||
Deficit |
DEF |
The difference between the maximum evapotranspiration and the water in the system (mm). | ||
Reserve |
RES |
The ammount of water reserved in the soil (mm). | ||
MaxReserve |
maxRES |
The maximum ammount of water can be reserved in the soil (mm). When this value is reached, the soil is fully saturated. |
- Note on calculation:
- If users are interested in the calculation of PET using the Thornthwaite method or other techniques, they can consult the original paper [1] on the Thornthwaite method, as well as a review [3] of common methods. Additionally, for those looking to understand the calculation of other output parameters, the source code is available for reference.
- To more precisely represent the reality, we use a "wrapping" approach for the initial data -- The starting "reserved water" (storage) for January depends on that of December of the previous year, which is obtained by running a full-year simulation using "maximum storage". All monthly storage values are then recalculated using this simulated data.
Climate Gaussen Diagram
Bagnouls-Gaussen diagram provides a visual representation of a region's climate, focusing on the relationship between temperature and precipitation. This component can be used to automatically draw the Bagnouls-Gaussen diagram with given climate data.
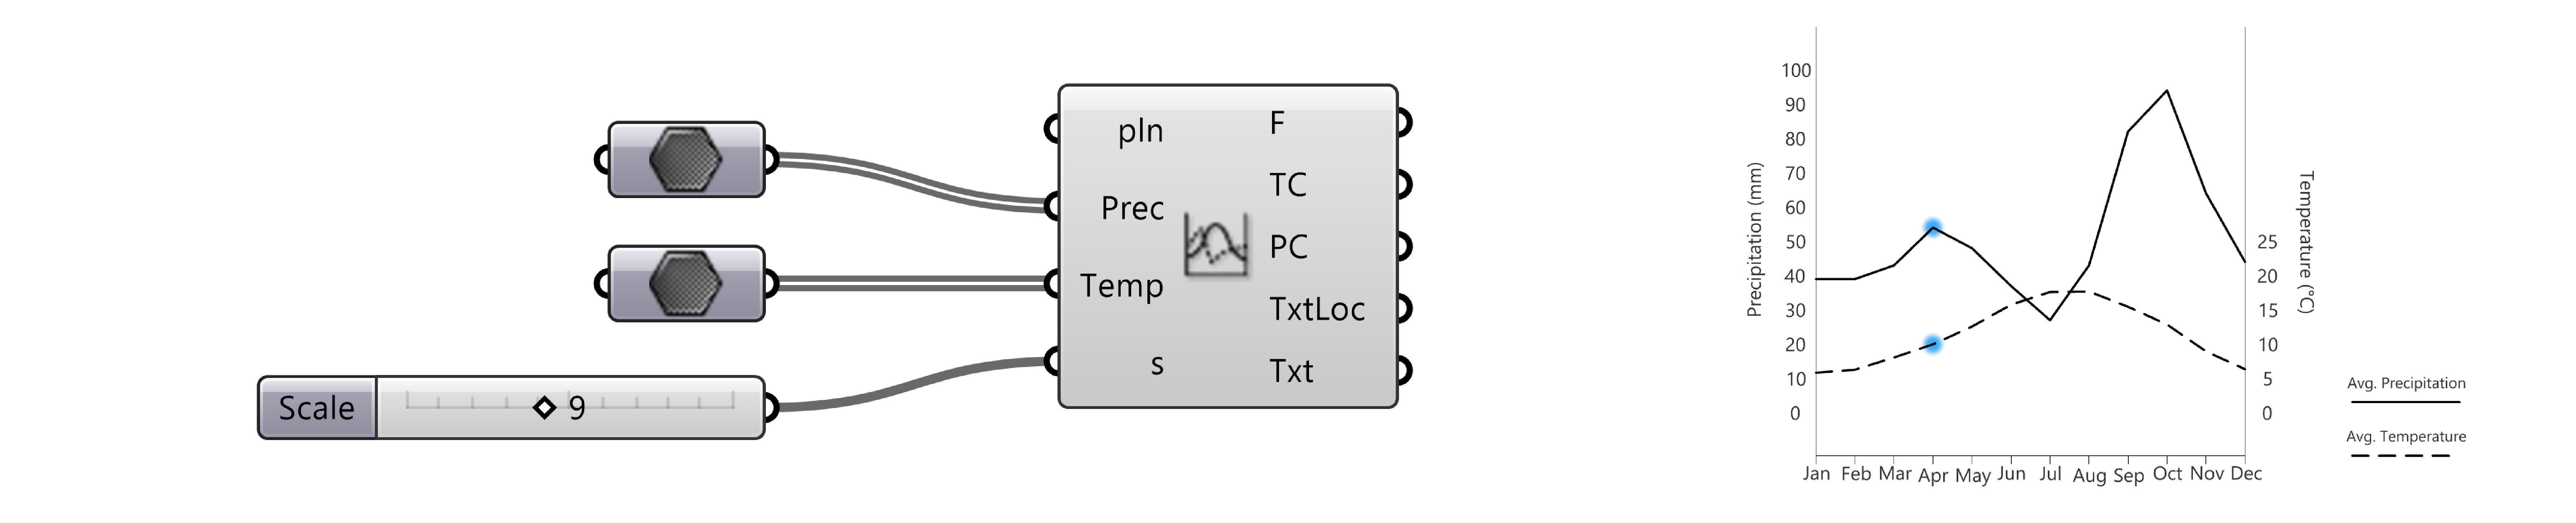
| Parameter | Abbreviation | I/O | Optional | Explanation |
|---|---|---|---|---|
Plane |
pln |
Yes | The plane to draw the diagram. | |
Precipitation |
Prec |
Yes | Precipitation (mm) of given location in 12 months. | |
Temperature |
Temp |
Yes | Temperature (°C) of given location in 12 months. | |
Scale |
s |
Yes | Scale of the diagram. | |
Frame |
F |
The Frame of the Gaussen diagram. | ||
Temperature Curve |
TC |
The temperature curve of the Gaussen diagram. | ||
Precipitation Curve |
PC |
The precipitation curve of the Gaussen diagram. | ||
Label Location |
TxtLoc |
The label location of the Gaussen diagram. | ||
Label |
Txt |
The label text of the Gaussen diagram. |
- Notes: This component primarily generates the basic framework and curves for Guassen diagram, allowing users the flexibility to customize its style. To create a fully-styled diagram, additional components that define specific styles must be integrated. For guidance on this process, please refer to our example in the Demo file section.
Demo File
The Evapotranspiration Demo (.gh file) is a grasshopper file that shows the use of Climate Evapotranspiration component. Please see the documentation section for more details.
The Guassen Diagram Demo (.gh file) is a grasshopper file demonstrating how to generate a Gaussen diagram. Note that this example uses components from the Human to define the width of curves. Users can install this package via the PackageManager in Rhino.
References
[1] Thornthwaite, C. W. “An Approach toward a Rational Classification of Climate.” Geographical Review 38, no. 1 (January 1948): 55. https://doi.org/10.2307/210739.
[2] Allen, Richard G., Luis S. Pereira, Dirk Raes, and Martin Smith. Crop evapotranspiration: Guidelines for computing crop water requirements. Rome: FAO, 2004.
[3] Melo, Giovani L., and André L. Fernandes. “Evaluation of Empirical Methods to Estimate Reference Evapotranspiration in Uberaba, State of Minas Gerais, Brazil.” Engenharia Agrícola 32, no. 5 (October 2012): 875–88. https://doi.org/10.1590/s0100-69162012000500007.