Demonstration
Introduction
In this section, we provide several complete examples showing potentials and possible applications of the plugin.
Soil
Soil Profile Comparison
The BeingAliveLanguage plugin can be used to visualize quantitative soil data obtained from field surveys or lab analyses and convey this information into straightforward diagrams. Indeed, one of the primary purposes of developing BeingAliveLanguage is to facilitate communication between soil scientists and professionals from other disciplines, such as architecture, landscape design, urban planning, using a unified visual tool. Typical applications for visualizing soil information involve comparing soil conditions across different soil horizons, contrasting multi-horizon soil profiles, and illustrating various aspect within the soil, such as soil water content and organic matter.
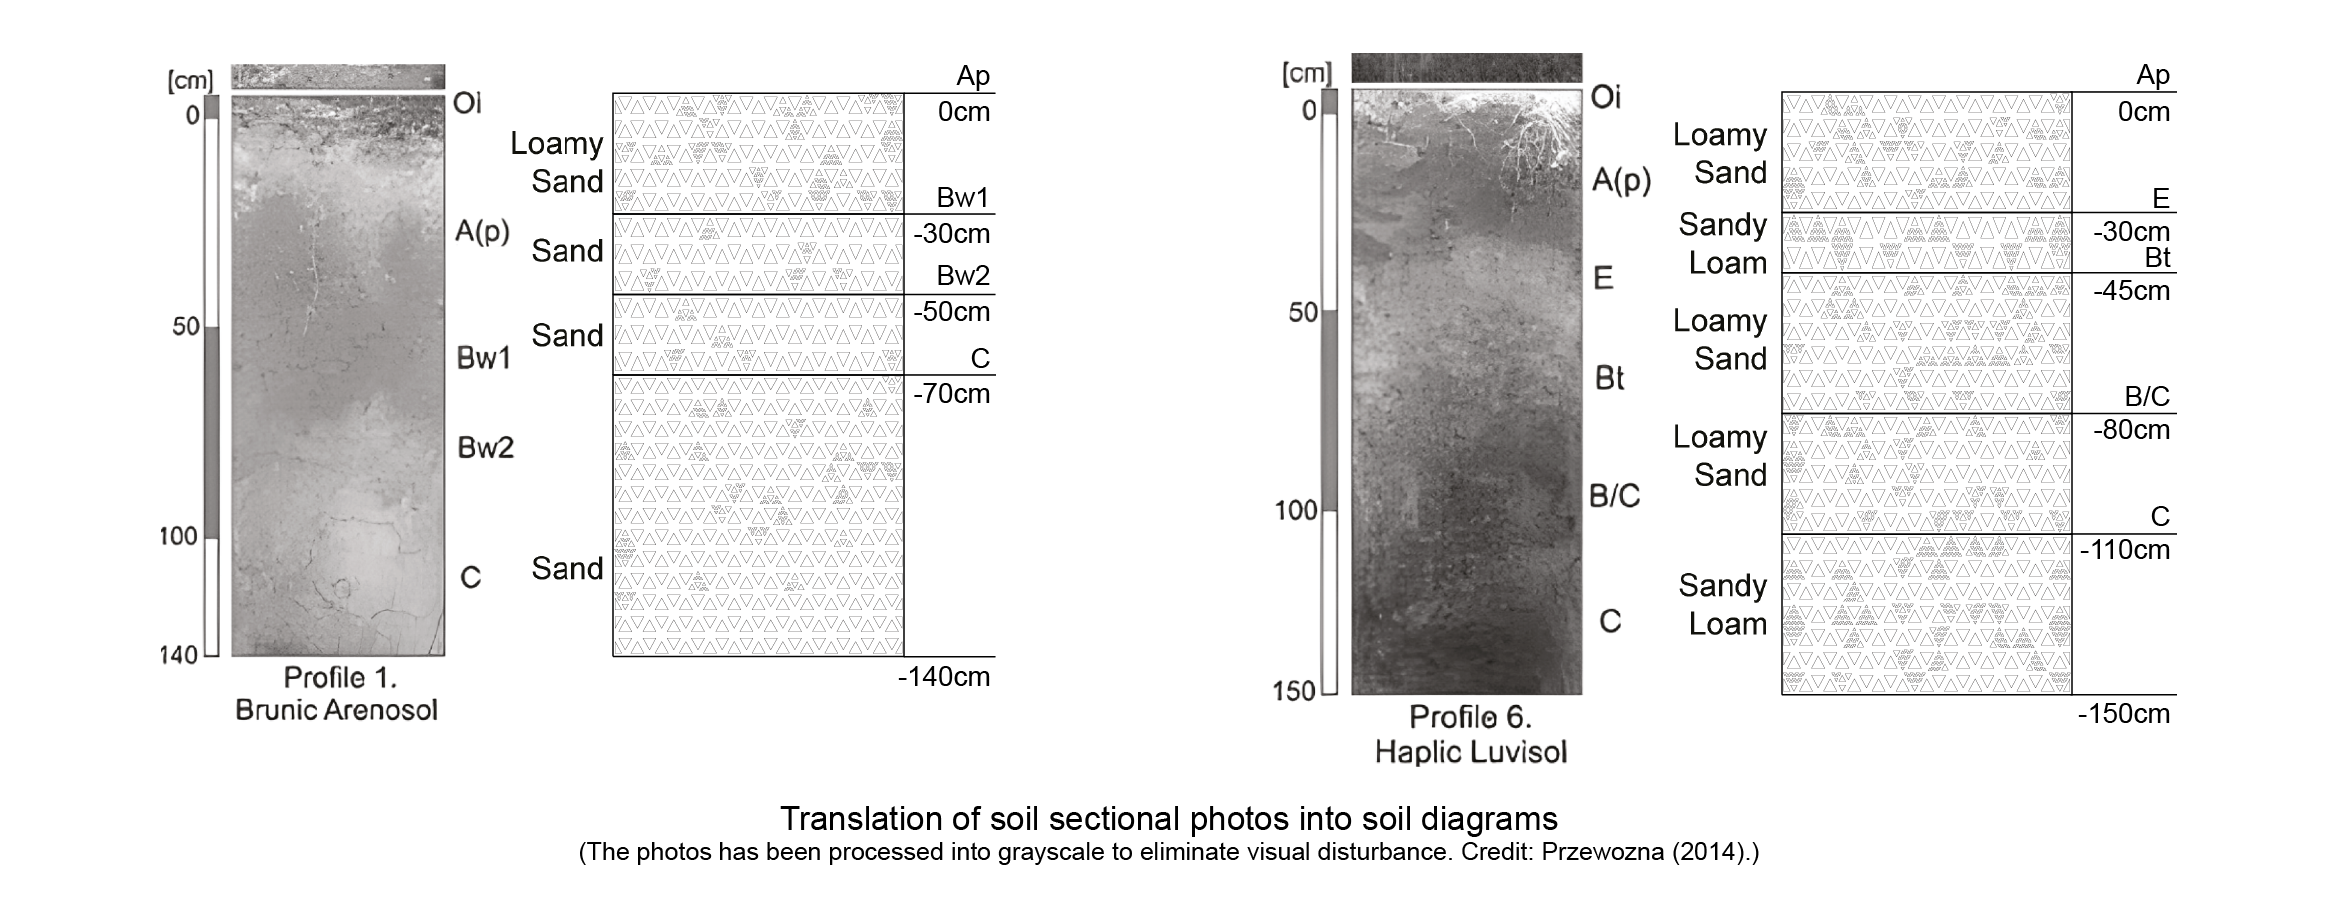
In the following examples1 2, the first one shows the translation of soil sectional photos into redrawn diagrams section by section, where the diagrams visualize and faciliate the comparisons between soil profiles.
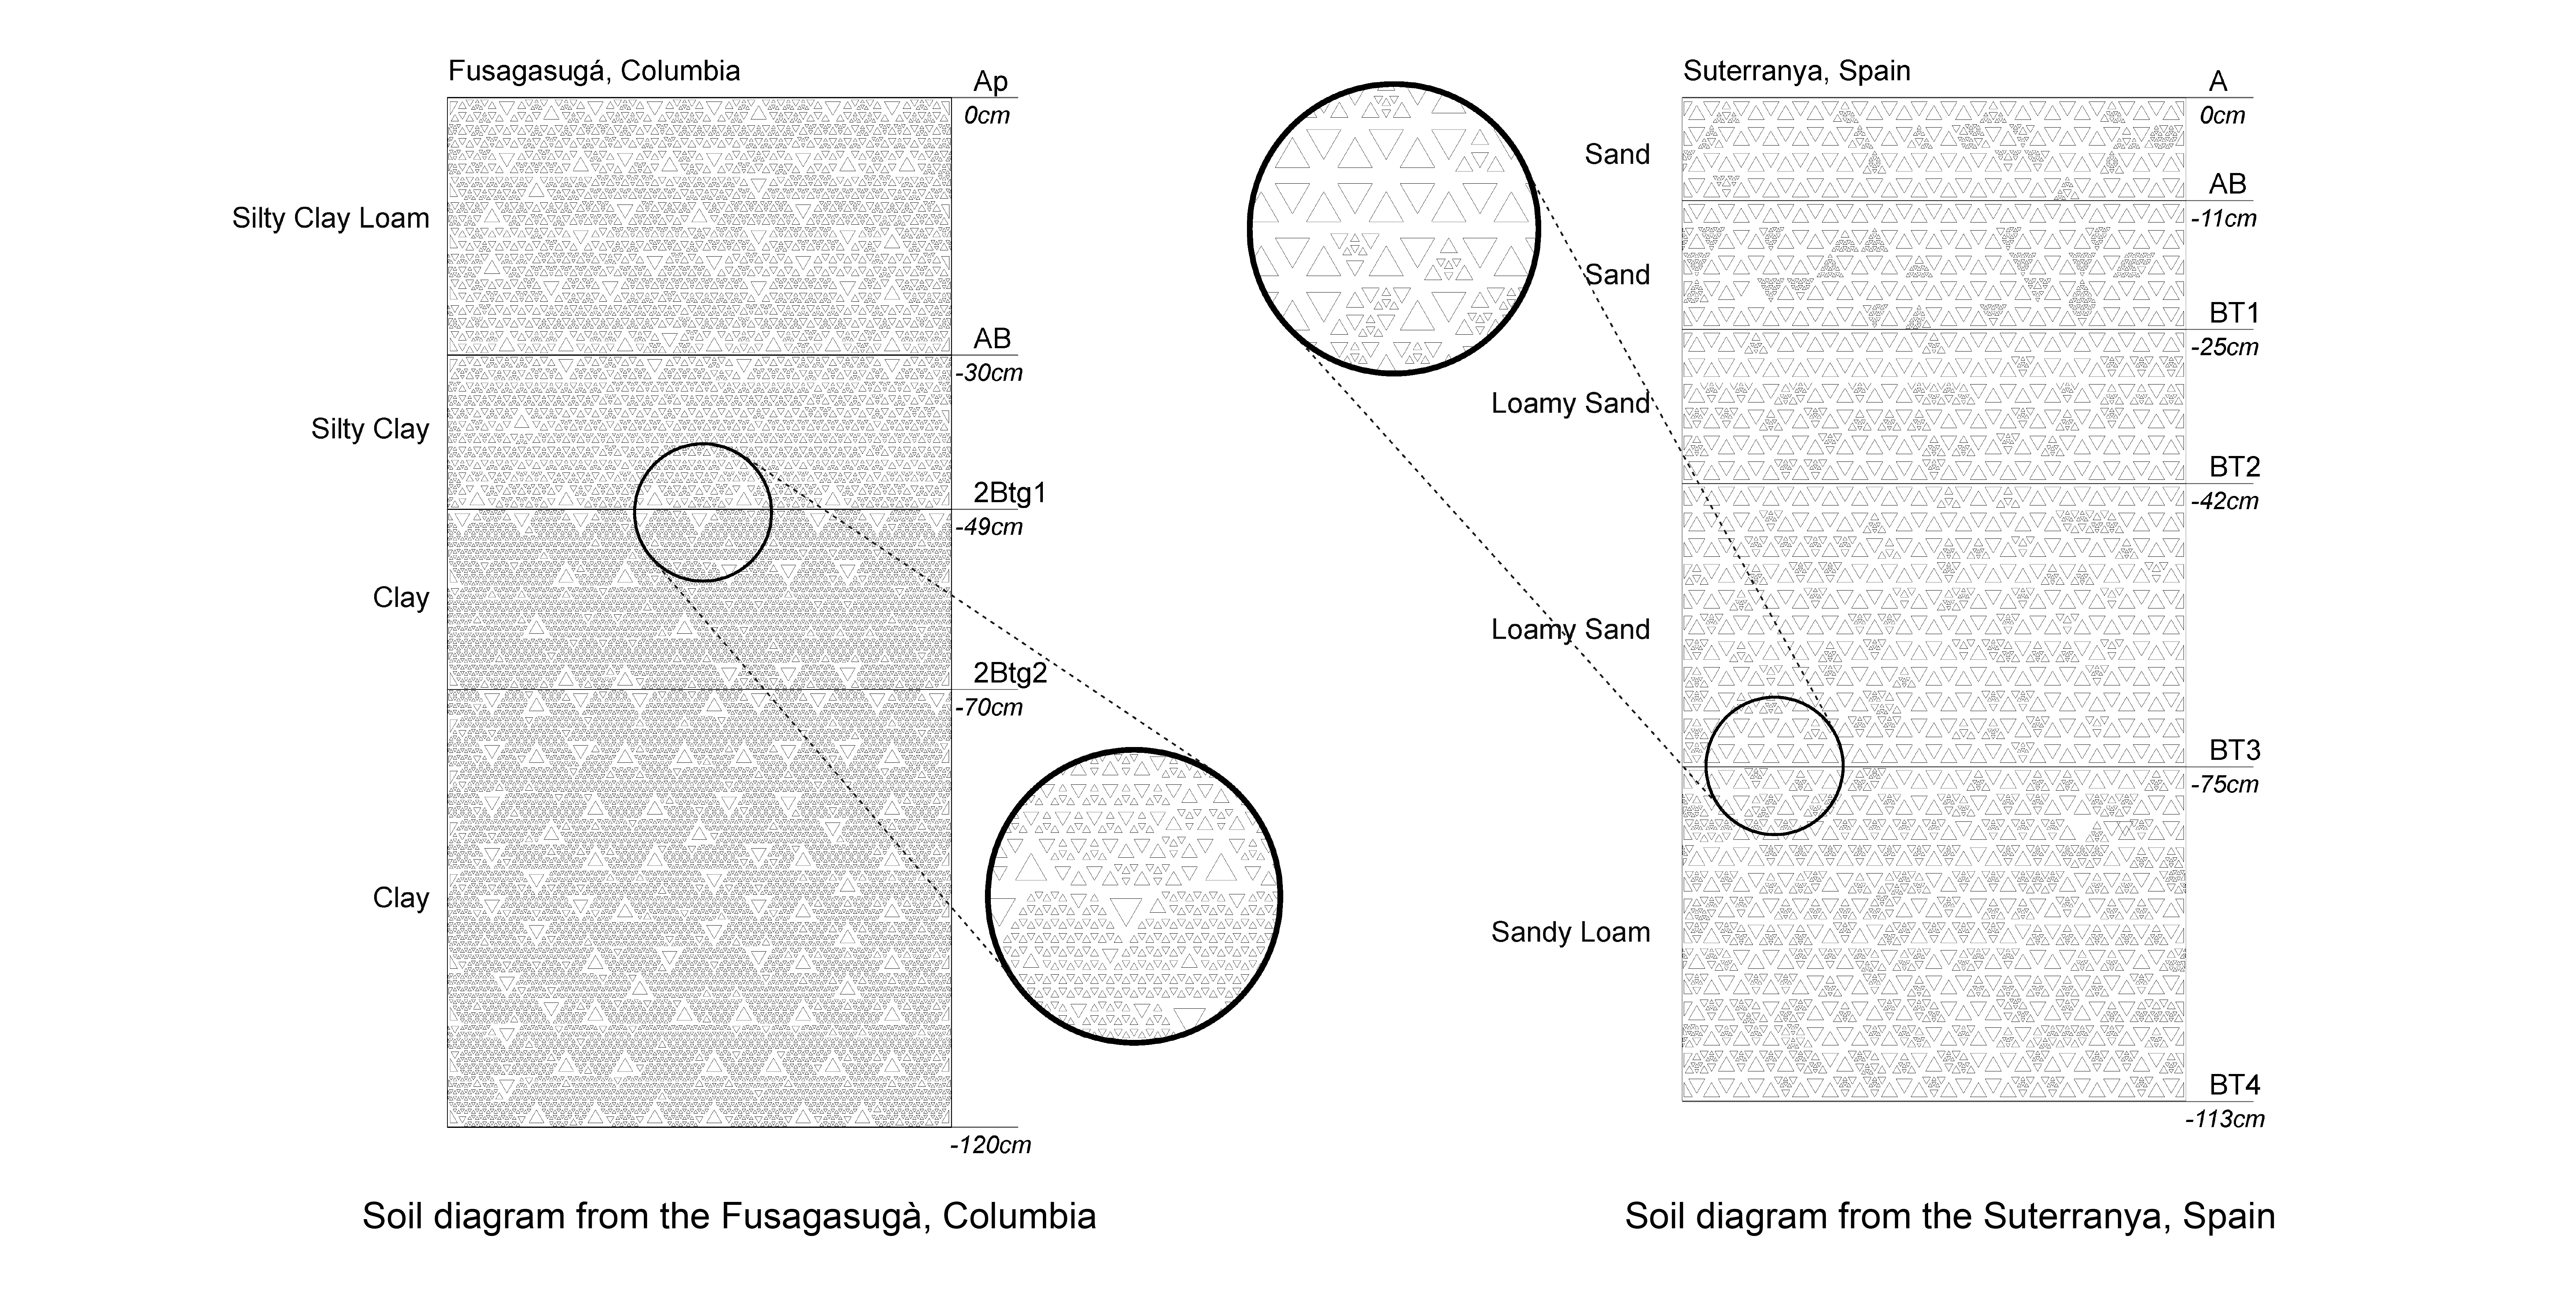
The second example, with more contrasts, shows the soil profile diagrams from two geographically distant locations, Fusagasugà, Colombia, and Suterranya, Spain. The contrasts across soil horizons, as well as between different soil profiles, are clearly demonstrated.
Climate Graph Integration
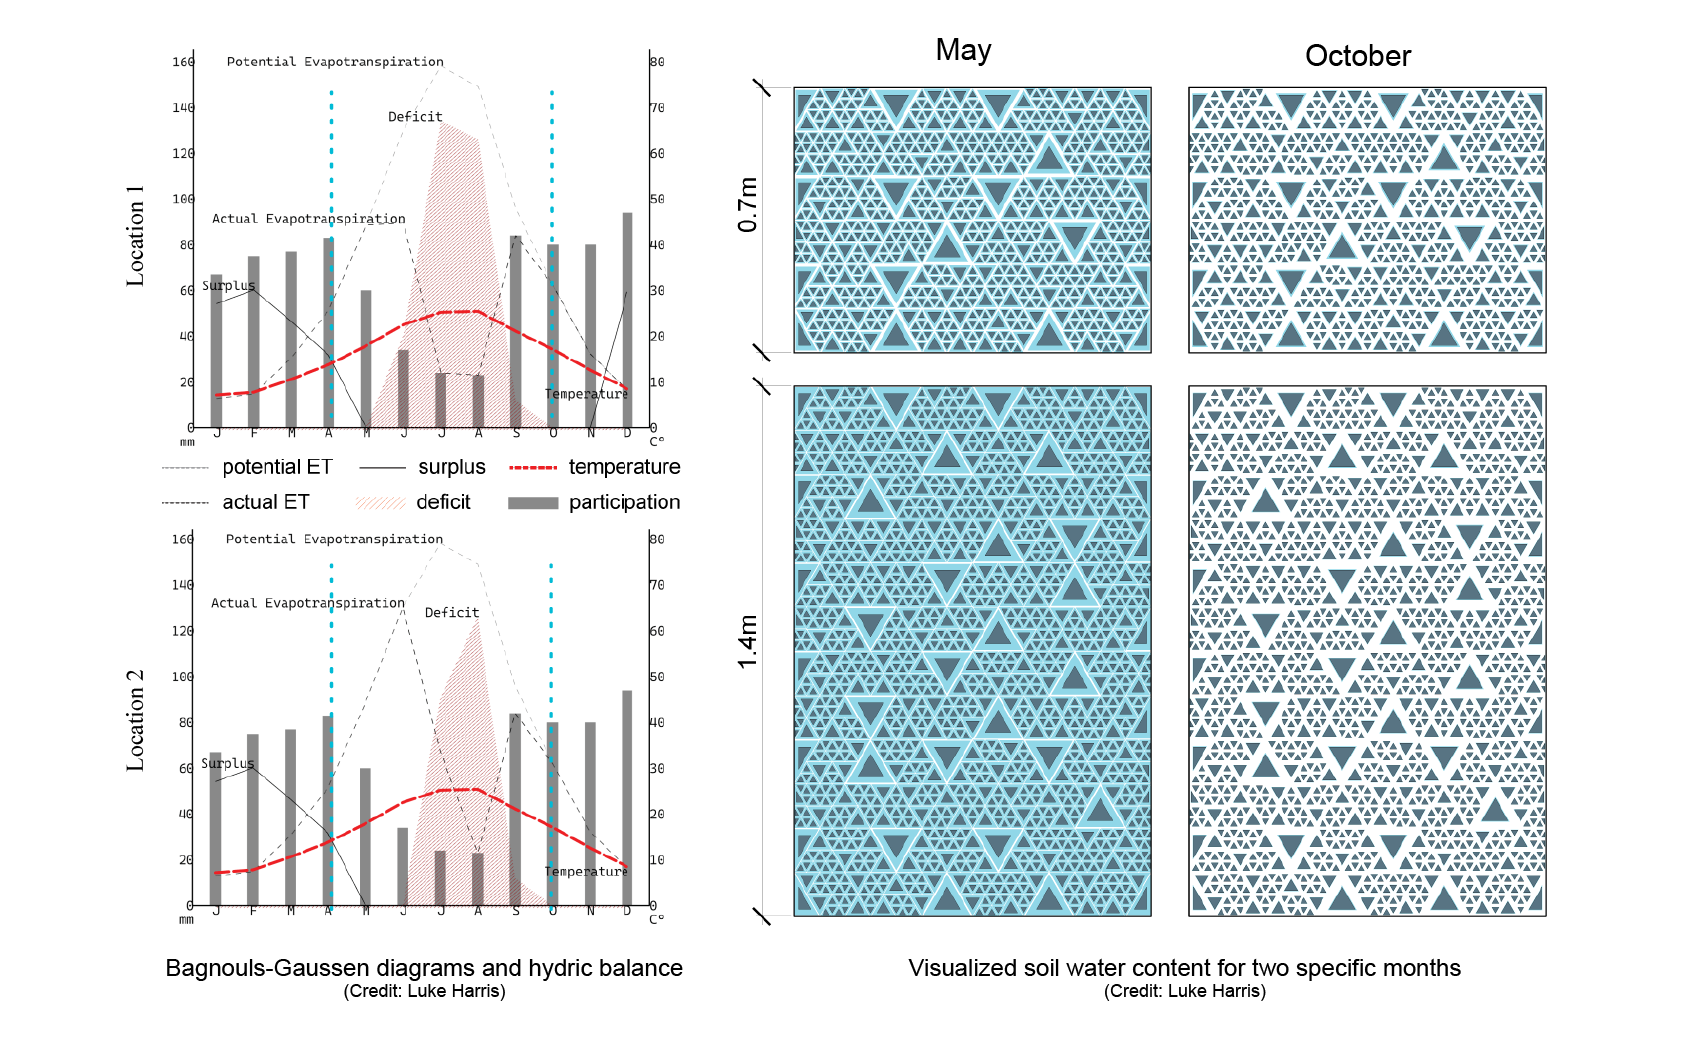
The BeingAliveLanguage plugin has the ability to integrate climate data extracted from water balance graphs or Bagnouls-Gaussen diagrams, which describe the relationship between temperature and precipitation, to illustrate the limiting factors (mainly the duration and intensity of drought) for plant growth and reproduction.
For example, given a specific geographic location, if monthly temperature and precipitation data are available, either from a meteorological station or an existing Bagnouls-Gaussen diagram in other studies, one can estimate the potential evapotranspiration and corrected evapotranspiration using the climate component. The component can further provide information about the soil's hydric balance, including surplus, deficit, and reserved water amounts. Furthermore, the soil water content ratio in different months can be determined by taking into account the soil texture and the maximum reserved water amount. Lastly, the soil water content ratio can be represented in the visualization system, which is shown in the following figure.
Drawing Vital Milieus
The BeingAliveLanguage plugin can be utilised to draw the reproductive cycle of an organism as a circular calendar that displays an organism’s milieu as a section cutting through soil, water, and air on a specific site. Therefore, the information for the soil profile is mapped onto circle segments using the fan mapping tool; information for water and air quality is displayed using a custom script according to a set of base parameters (Fig. 05). Temperature and rainfall curves, as well as cyclical interactions on site like mowing or pruning, can be added manually. The organism, a plant or animal (or multiple), can be drawn with polylines into the circle or mapped onto the segments using the fan mapping tool. This method is being developed as part of the doctoral thesis “An Earthly Writing of Space” (Johanna Just); it attends to other-than-human rhythms and modes of inhabitation to make them visible and include them in spatial design processes.
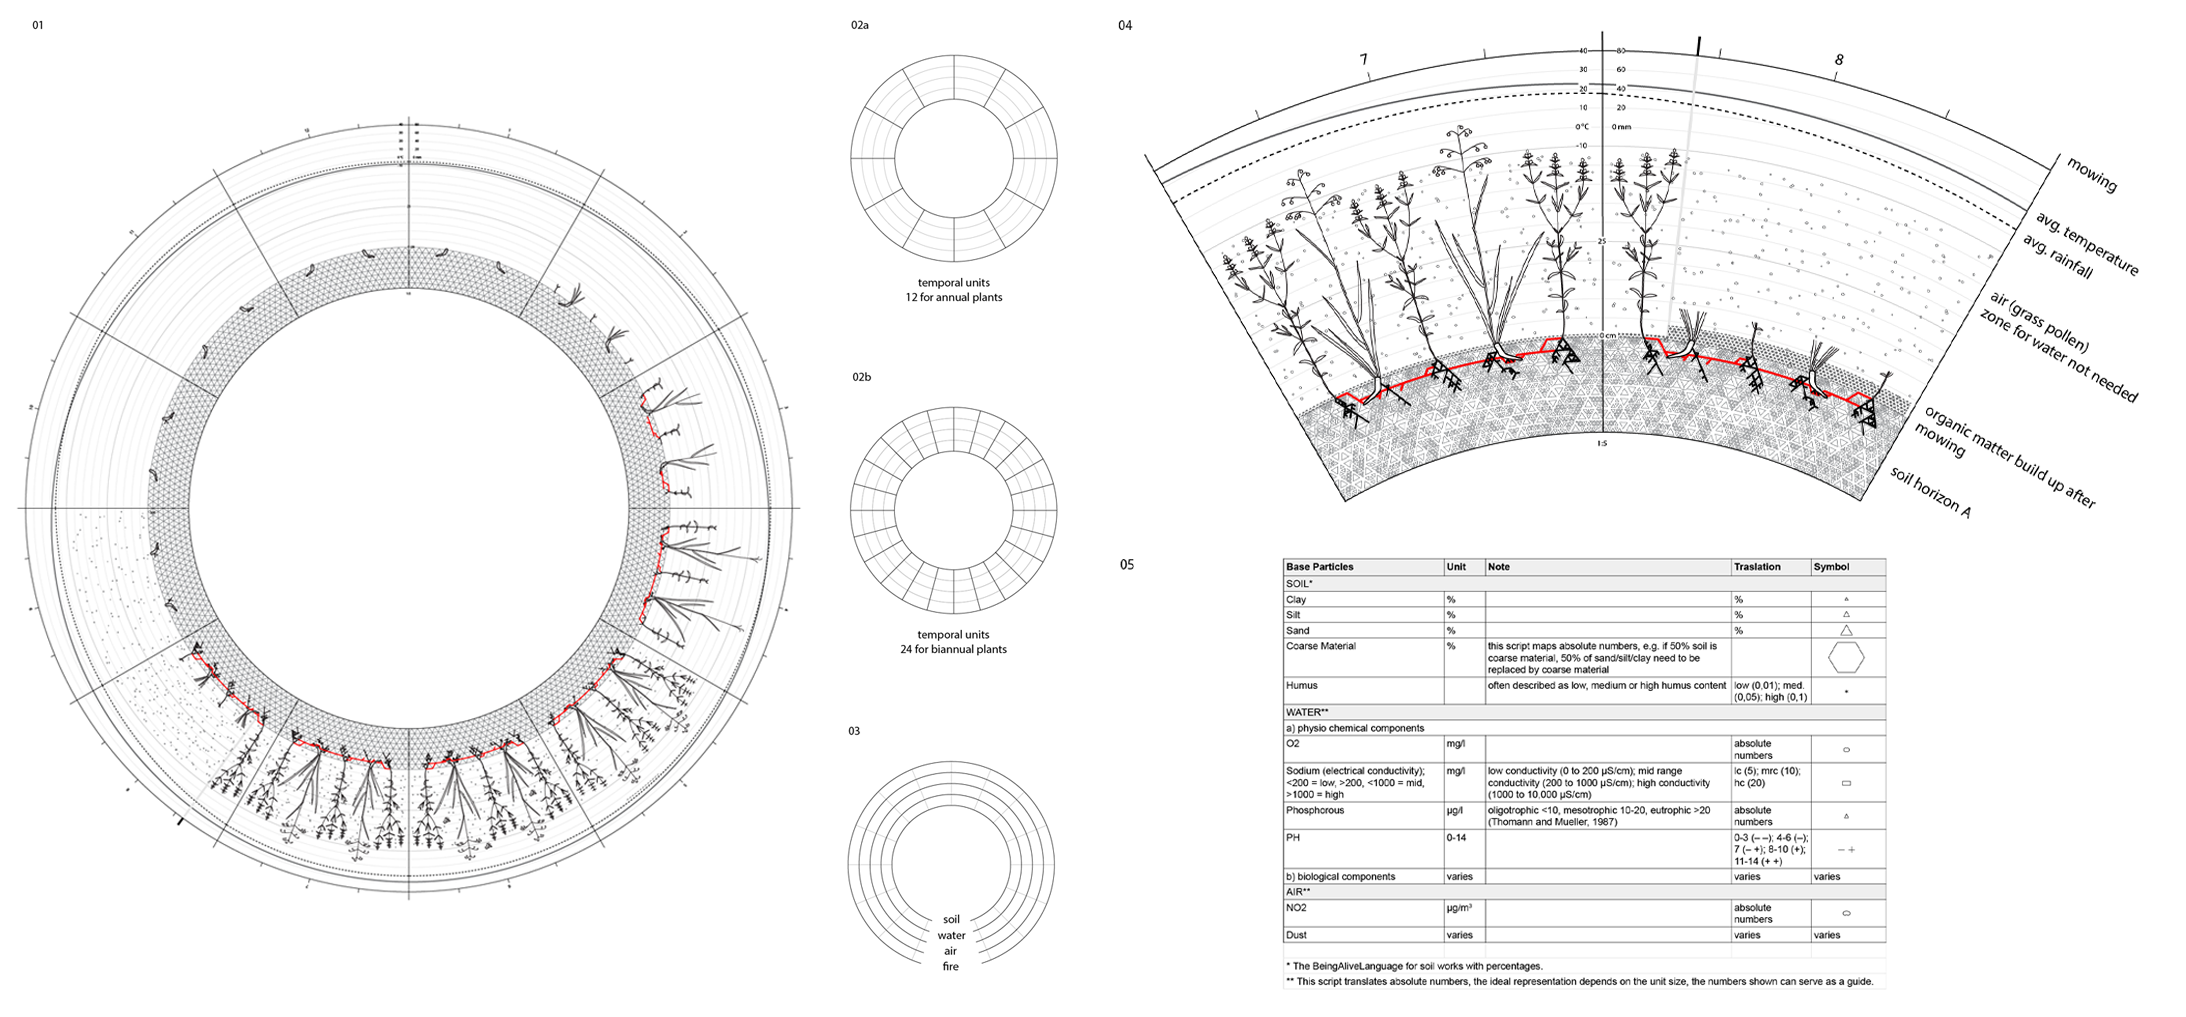
Fig. 01 Example, drawing of the vital milieu of Rhinanthus minor, an annual herbaceous wildflower that grows in dry meadows and is parasitic on grasses like Briza media. Mowing happens in early August. Credit: Johanna Just.
Fig. 02a Template for an annual plant, 12 months; Fig. 02b Template for a biannual plant, 24 months; Fig. 03 Horizontal division showing the quality of soil, water, air and climate. Credit: Johanna Just.
Fig. 04 Example drawing showing July and August for Rhinanthus minor. Credit: Johanna Just.
Fig. 05 List of base parameters for soil, water and air. Credit: Johanna Just.
Root
Planar Root Generation
The BeingAliveLanguage plugin also allows the ability to visualize dynamic root systems across multiple phases of growth, and multiple stages of the root systems life in planar root diagrams. Roots are explorers, and they are integrally connected to the substrate they explore through a dense and sensitive network of relationships with other organisms. Roots weave through the ground searching for nutrients, water, and partnerships with other living entities. The plugin allows you to diagram this search upon simulated soil examples that are used to define the network of existing soil conditions in which roots grow. It also allows for the opportunity to simulate areas of environmental factors, or areas of environmental Attractors and Repellers that facilitate or hinder the growth of roots in these areas.
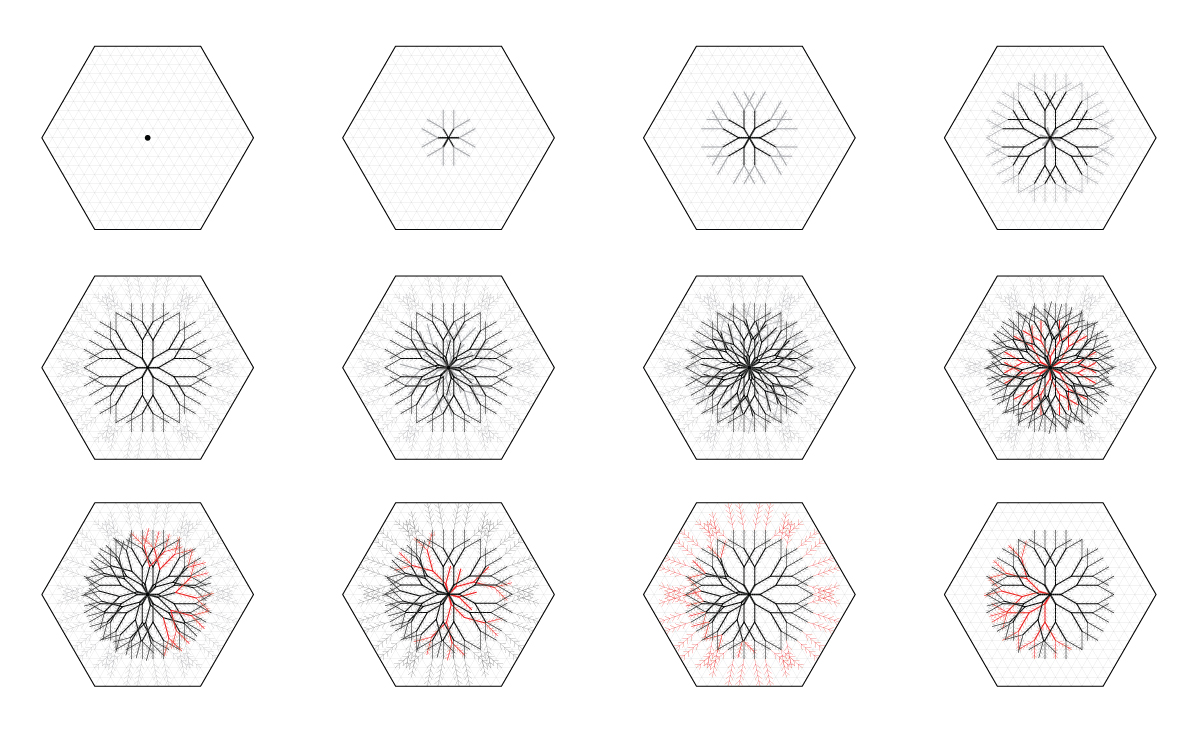
For example, the following figure demonstrates various stages of growth and death for an example root system by diagramming the root system at twelve different stages. The phases of growth are represented by showing new lateral roots or Secondary Roots in grey, existing roots from the previous phase of growth or Primary Roots in black, and Dead Roots in red. The progression of expanding growth in the planar condition of roots can be seen through the first seven examples in the figure. While the progression of death of the root can be seen in the last five examples in the figure.
Sectional Root Generation
The BeingAliveLanguage plugin also allows for the simulation of root growth in section as a method of diagramming the depth in which a root can reach throughout its growth as well as the root at various phases of its lifecycle. While the primary influence on a root system’s growth direction is gravity, the condition of the soil in which the root grows also plays a pivotal role in the directional growth of root systems. The plugin allows you to first simulate the soil conditions and properties through the included soil components, and then to simulate the growth of various root systems within these soil conditions. As well as allows for the simulation of these root diagrams across multiple phases of the root’s growth and life.
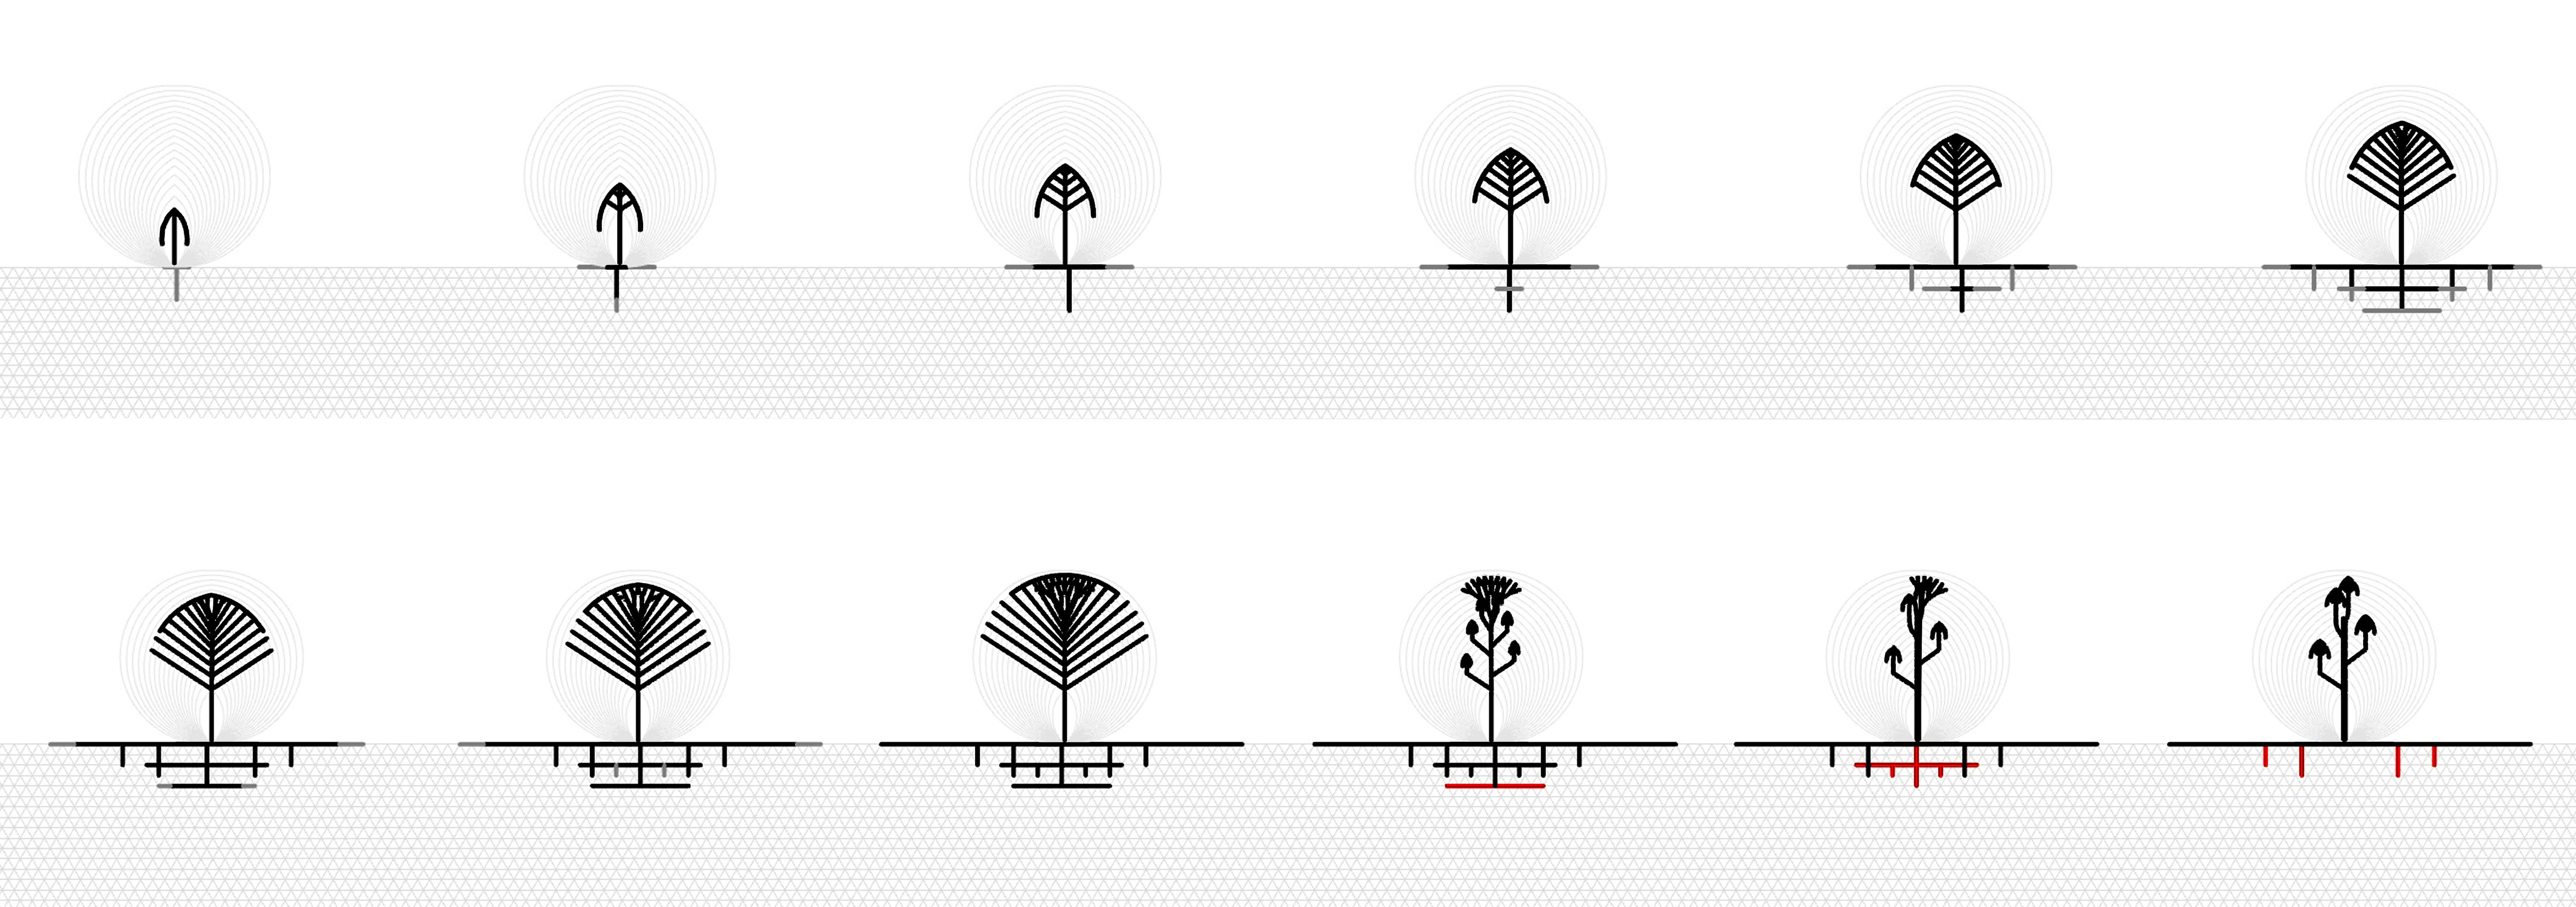
For example, the included diagram shows an example in which the roots are generated sectionally for a tree. Similar to the planar root figure the included figure shows the root growth at twelve different example phases of growth and the roots life. The phases of growth are represented by showing new lateral roots or Secondary Roots in grey, existing roots from the previous phase of growth or Primary Roots in black, and Dead Roots in red. This allows the plugin to simulate the generation of layered root systems across various points of the root system’s life.
Tree
Energy Analysis
The BeingAliveLanguage plugin is able to generate 3D trees along with their corresponding energy canopies. These trees can be adjusted in terms of phase and shape for various representations. The energy canopy serves as an abstract representation of the tree's shape, facilitating integration into energy analyses pertaining to the trees.
Using a courtyard in Barcelona as a case study, the example explores the radiance and thermal impacts of various tree planting designs on the surrounding environment. The trees and energy canopies are generated using Drénou Model and Tree Energy Canopy components, while simulations and energy analyses are conducted using Ladybug Tools. To access these tools, users can visit the relevant page to select and download the necessary components or opt for the Pollination plugin for Grasshopper, which consolidates all essential tools into one package.
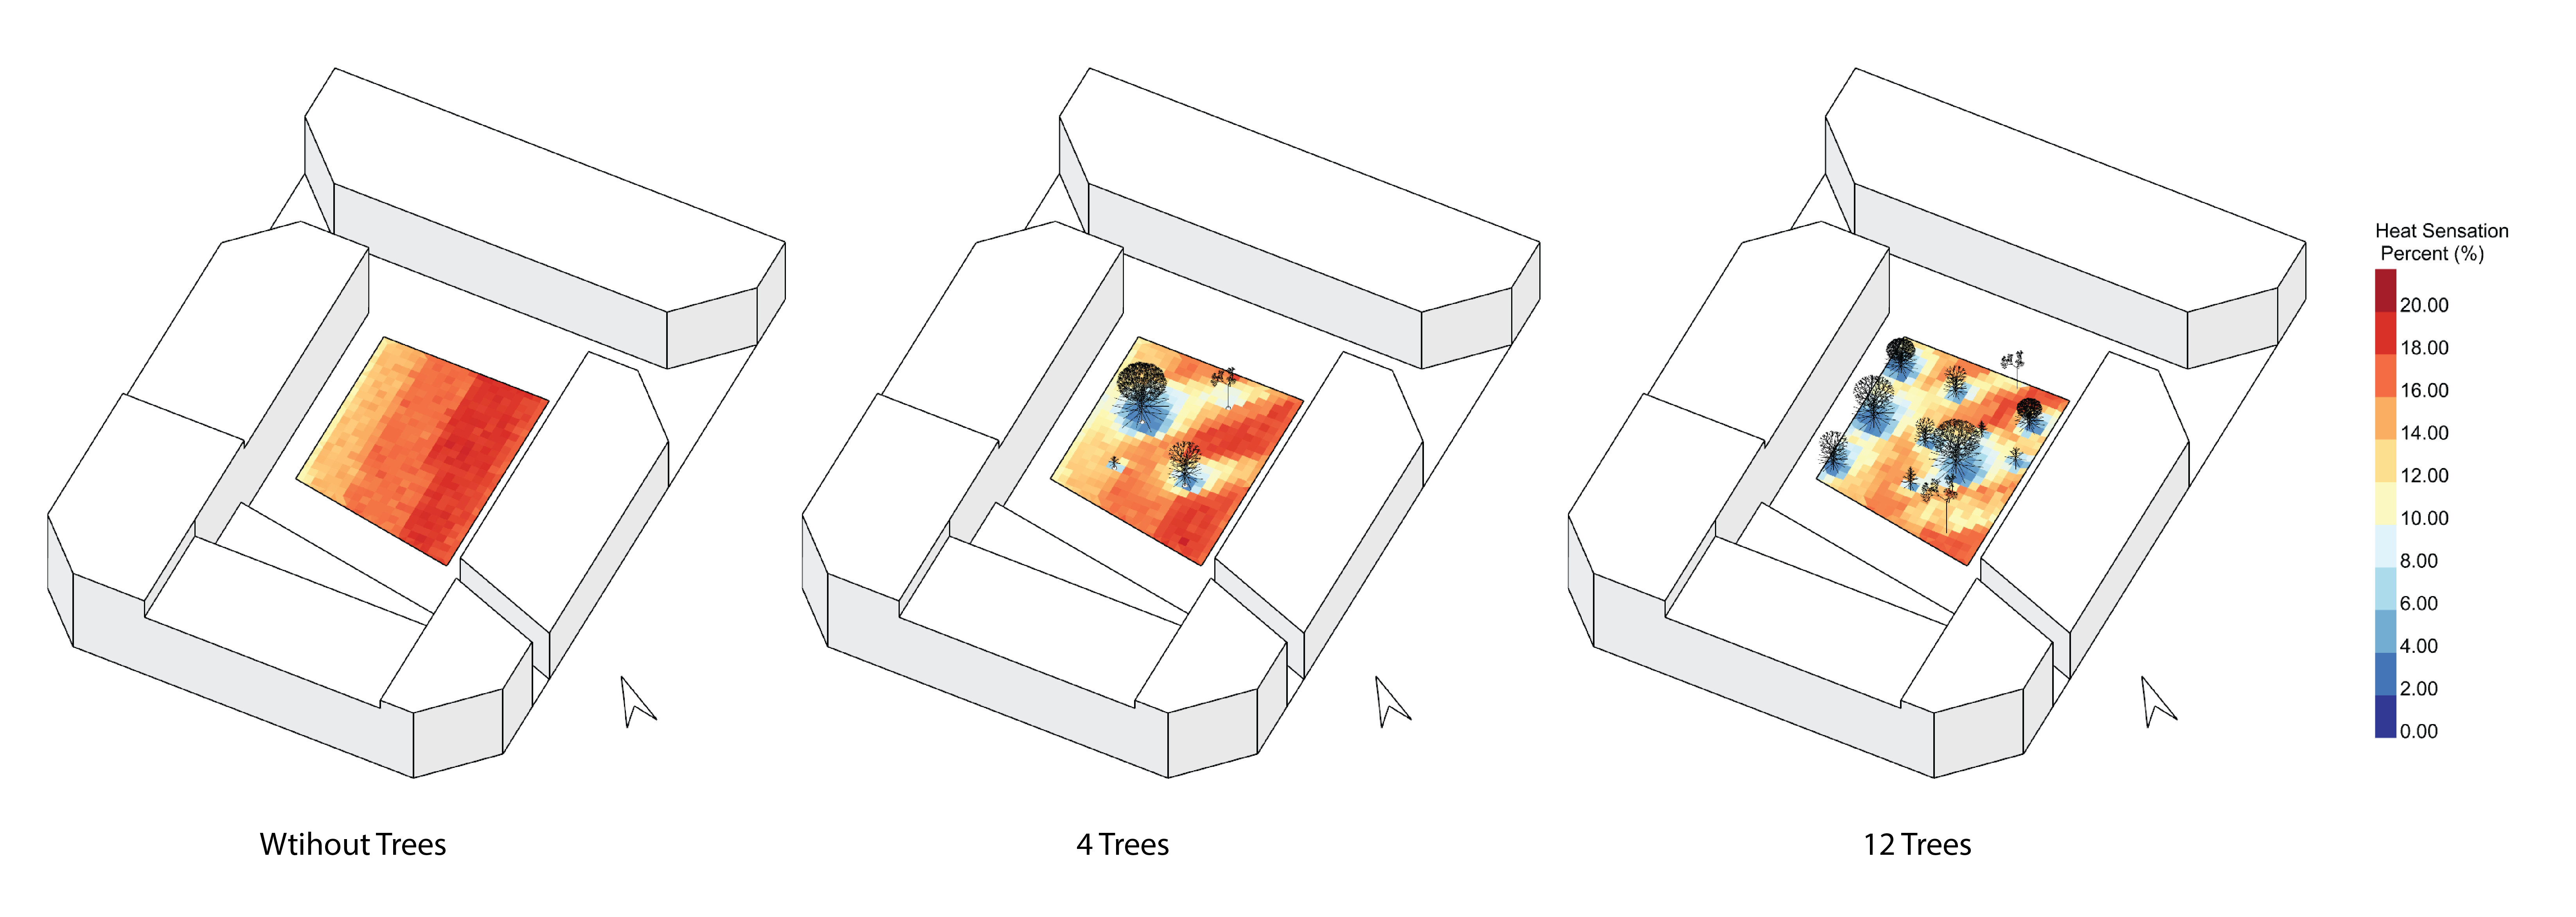
In this example, the generated tree canopies are treated as semi-transparent shading components, while surrounding buildings are modeled as opaque objects. The analysis covers the entire month of July. Below, we present distribution of heat sensation, which indicates the percentage of occupied time during which thermal conditions exceed what is considered acceptable or comfortable. With an increase in tree coverage, the area becomes significantly cooler and more enjoyable for residents. It is important to note, however, that this analysis is simplified; it focuses solely on the shading effects of trees. Other cooling benefits, such as evapotranspiration, are not considered in this example.
The Tree Energy Demo (.gh file) is the corresponding grasshopper file for the example.
-
Ma, Z. and Gali-Izard, T., 2023. BeingAliveLanguage: Visualizing Soil Information from a design perspective to enhance multidisciplinary communication, Ecological Informatics, 76, p. 102151. https://doi:10.1016/j.ecoinf.2023.102151. ↩
-
Przewozna, B., 2014. Changes of bulk density, air-water properties and morphology of soils in basins without outlets as an effect of erosion and anthropogenic denudation (a study from northwestern Poland). Soil Sci. Plant Nutr. 60, 30–37. https://doi.org/10.1080/00380768.2013.842456. ↩